Greater Manchester Older Adults Activity Levels Nov 17-18
As we age, inactivity (less than 30mins a week) increases, with older adults being more than twice as likely to be inactive, 75+ years 54% and 55+ years 36.8% compared to 16-34 year olds 18.7% in GM.

Statistics show 54% of those aged 75 and older are inactive. This is compared to 36.8% of adults aged between 55-74, and 18.7% of 16-34 year olds in Greater Manchester (GM).
Inactivity levels in Greater Manchester have been declining since 2015-2016 across all age groups. Yet figures remain higher than national statistics. Our region’s inactivity levels are higher in every age category than the national figures, and higher by almost 10% amongst 55-74 year olds.


Those that are inactive aged 55 years and over (270,100) account for 45% of all that are inactive aged 16 years and over (596,800) in GM. Although the percentage of inactive 55+ years in GM has declined since 2015-16 (from 39% to 36.3%); this is more within the 55-74 years age group (by -3%) than the 75+ years (by -1.1%).
What’s happening across Greater Manchester?
To make an impact, we need a clear picture of the differences across Greater Manchester. For older adults aged 75+, inactivity levels are as high as 68.2% in Tameside (falling to 44.8% in Rochdale). Bolton, Bury, Stockport, Tameside and Trafford have seen an increase in inactivity since 2015-2016. However, older adult inactivity levels in Manchester, Rochdale and Wigan have decreased (by as much as -18.2% in Wigan).
There are also huge disparities in activity levels across the 55-74 year olds in our boroughs. Inactivity levels for this age group are 38.8% in Manchester, but only 22% in Trafford. Again, there have been inactivity increases since 2015-2016 (in Manchester, Oldham and Stockport). Yet levels in Salford, Tameside, Trafford and Wigan have all decreased (by as much as -11.8% in Tameside).

What’s happening across demographics within older people?
Within this older age group as whole, inactivity levels already vary. In older adults, inactivity amongst women remains higher than for men (32.5% compared to 27.4% for 55-74 years and 61% compared to 48.3% for 75+ years respectively).
Inactivity in older adults with a long-term disability or health condition increases by at least 20% above those without.
Nationally inactivity is higher for older adults from South Asian and Black ethnicities than White British ethnicities, (55-74 years: 38.7% and 35.7% compared to 26.8%) (75+ years: 57.4% and 54.6% compared to 51.1%). However, there are not enough responses in GM to report this.
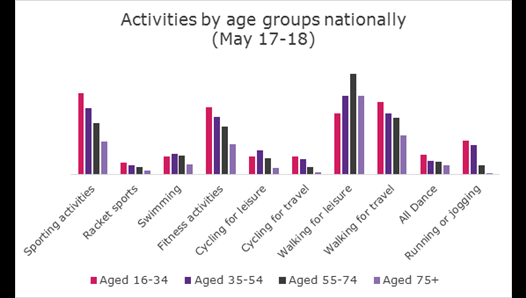
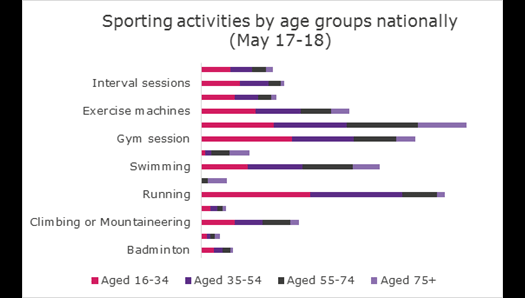
What activities are most popular with older people?
Walking for leisure is by far the most popular activity for older people (54.2% for 55-74 years and 42.7% for 75+ years). With walking for travel (30.5% and 21.1%) and sporting activities (27.8% and 17.7%) following this. Within this the most popular sporting activities are fitness classes (14.7% and 10.1%), swimming (10.4% and 5.6%) and gym sessions (8.7% and 4%).
Why is older adult inactivity so important?
The overall population of Greater Manchester is set to grow 13% by 2039, reaching 3.1 million. This growth will largely be driven by the increasing number of older people.
By 2039, Greater Manchester’s working age population should grow by 5%. The number of our region’s residents aged 65+ will expand by 53% over the same period to reach 650,000. This will double the number of over 85s in Greater Manchester to over 100,000, and the overall number of residents over 50 will grow by a third by 2039.
A hugely significant growth in the number of older adults is expected in Greater Manchester. So it’s increasingly vital we support them to get moving.
How can you help older adults?
At GreaterSport, we know we have a duty to care for and support our region’s older adults. And, with the elder population set to grow, it is essential we decrease inactivity across the group as a whole.
Current statistics are worrying. But, we know we can change them and get more adults across Greater Manchester moving. Tell us how you can help us and, together, we’ll make a real difference.