Greater Manchester Children & Young People Activity Levels 2019/20
39.6% of children and young people in Greater Manchester meet Chief Medical Officer guidelines and achieve an average of 60 minutes or more of physical activity a day. Whilst 36.6% are failing to achieve 30 minutes of physical activity a day.

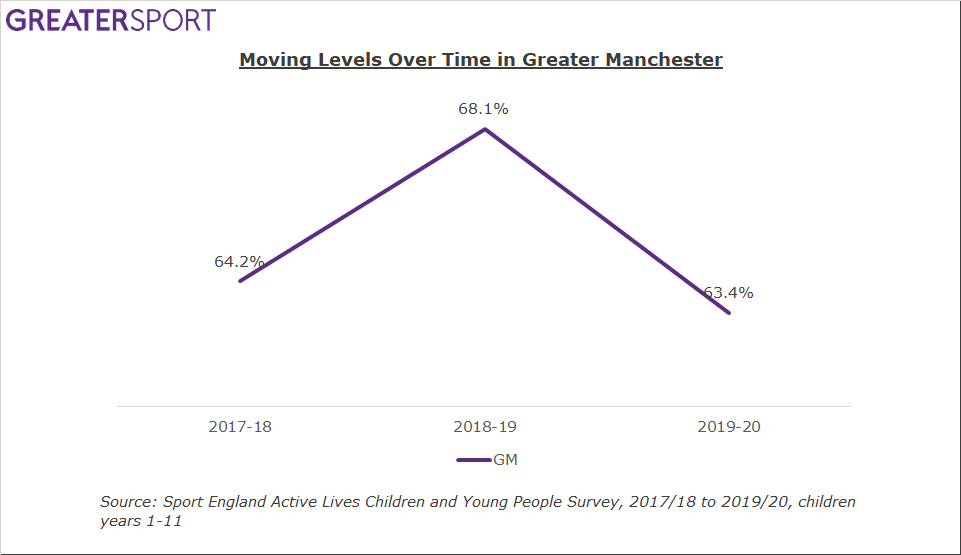
The latest Active Lives Children and Young People Survey data from Sport England has been released and has highlighted the impact Covid-19 has had on the activity levels of children and young people. Just 63.4% of children and young people in Greater Manchester (GM) are moving, achieving at least 30 minutes of physical activity a day, this is lower than the national rate of 68.7%. Whilst there has been a significant decrease (-5.6%) in children and young people being classified as active, an average of 60+ minutes a day, in the last academic year it is promising to see that there has been no significant change from baseline (2017/18).
Overall, 39.9% of children and young people are active, average 60+ minutes of physical activity every day, 23.8% are fairly active, achieve an average of 30-59 minutes of physical activity a day, and 36.6% are inactive, do less than 30 minutes of physical activity a day.
Borough Level Data
Please note that this data should be interpreted with caution, Covid-19 had a significant impact on data collection and the caveats for the data can be found below.
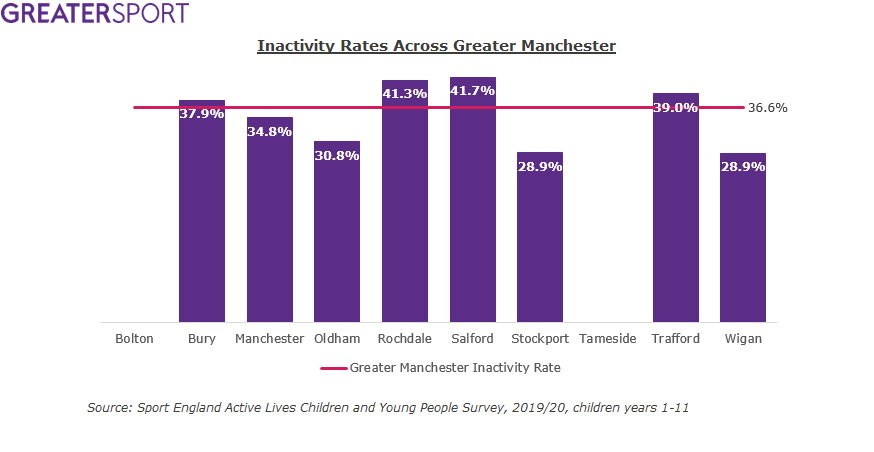
Inactivity rates vary considerably across Greater Manchester with there being a 12.8% gap between the boroughs with lowest levels of inactivity, Stockport and Wigan (28.9%), and the boroughs with the highest levels of inactivity, Salford (41.7%). This gap between boroughs has grown by 1.5% since the last release when there was an 11.3% gap.
Demographics
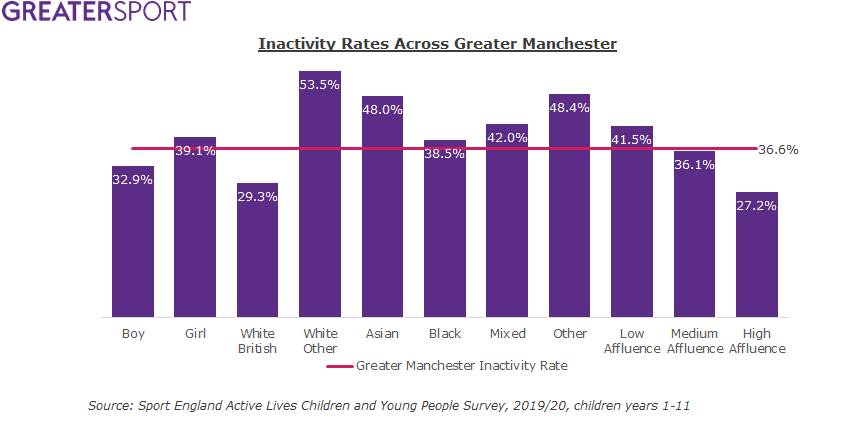
Across Greater Manchester we see a picture similar to previous years with less active rates higher than the GM average amongst girls, White Other, Asian, Black, Mixed, Other and low family affluence. Boys, whilst below average for less active have seen a significant decrease in the proportion classified as active (-6.4%), this does align with the national picture, boys have been particularly affected by Covid-19 and lockdown due to the restrictions on activity choice.
- Some of the data has been suppressed because they have less than 150 responses in total or only 1-2 responding schools in the LA meaning the data is insufficiently reliable
- Some data is flagged orange within the ‘Change compared to year 17-18’ or ‘Change to year 18-19’ columns. This is because as you can see on the ‘Geographical Flags’ tab, there are missing school phases or missing Terms within the data, again affecting the reliability / validity of assessing change to previous years.
As you know activity levels differ by term, and so where you are not comparing like for like the result will be different due to the profile, not solely through a genuine change – if there is a genuine change this will be hard to unpick. In the case of large changes you might assume the scale is exaggerated but the direction is likely, with smaller changes we would recommend not relying on these. The same applies with school phases.
Published January 2021