Manchester Adult Activity Levels November 2018-19
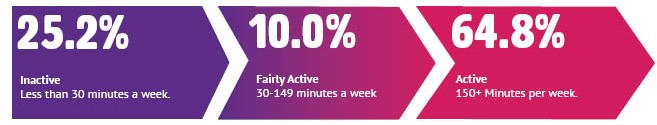
The latest Active Lives results published by Sport England shows that 74.8% of adults in Manchester are active for at least 30 minutes a week, this equates to 326,700 adults moving.

Manchester Overview
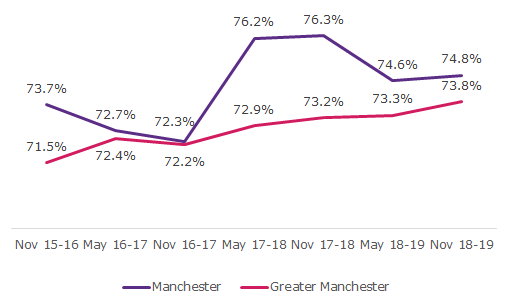
These results, whilst showing less people moving (active and fairly active) compared to the peak 12 months a go, do show an increase from the first Active Lives release in November 2015-16, with a 1.1% increase in the adult population moving. This increase is greater than England's increase (1.0%) but remains below the Greater Manchester increase (2.3%).
Manchester Moving Population Compared to Greater Manchester Over Time
Changes in inactivity
Since the first Active Lives release, (November 2015-16), Manchester has seen a decrease in inactivity levels across the majority of cohorts. The exceptions to this being 16-34 year olds, non-disabled people and those from higher and medium income categories, however these are only small increases. The largest decreases in inactivity have been amongst over 75’s with a 20.2% decrease, those in the lower income category, a 5.8% decrease, and those with a disability, a 4.1% decrease.
More information can be downloaded on the right.