Manchester Adult Activity Levels November 2019-20
The latest Active Lives results published by Sport England shows that 69.5% of adults in Manchester are active for at least 30 minutes a week, this equates to 306,500 adults moving. This is a decrease of 20,200 from 12 months ago.

Manchester Overview
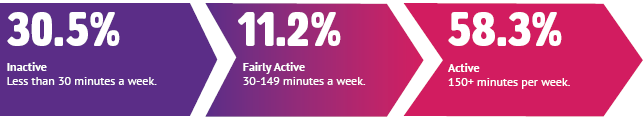
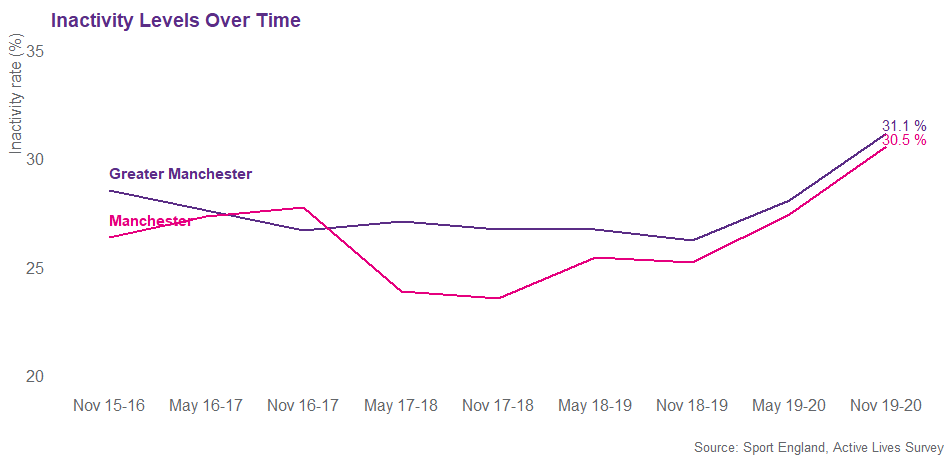
The latest Active Lives data shows that there has been a significant decline in activity levels across Manchester in the last 12 months. 69.5% of adults in Manchester are now moving (active and fairly active), this equates to 306,500 adults. Since Active Lives launched, November 2015-16, the inactivity rate has increased by 4.2%, meanwhile in Greater Manchester the rate has increased by 2.6%.
When this latest release is combined with activity data on children and young people, 356,600 Manchester residents are moving.
Find out more about activity levels of children and young people in Manchester here.
Demographic data
 |
The inactivity gender gap in Manchester is 0.1%Since November 15/16 the gender gap has decreased by 0.8%. This increase is a result of male inactivity increasing (+4.3%) at a faster rate than female inactivity (+3.5%). |
 |
The inactivity socio-economic gap in Manchester is 22.2%Since November 15/16 the socio-economic gap has decreased by 0.2%. This minor decrease has been driven by a larger increase in inactivity amongst higher socio-economic groups, NS-SEC 1-2, (+3.7%) than amongst lower socio-economic groups, NS-SEC 6-8, (+3.5%). Learn more about activity levels related to socio-economic status here |
 |
The inactivity disability gap in Manchester is 15.9%Since November 15/16 the disability gap has decreased by 7.7%. This narrowing of the gap is a result of higher rates of inactivity amongst those with no long term limiting disabilities (+6.5%) and a decrease in inactivity amongst those with a long term limiting disability (-1.2%). Learn more about activity levels related to disability and long term health conditions here |
 |
The inactivity age gap in Manchester is 28.5%Since November 15/16 the age gap has decreased by 23.8%. This decrease has been driven by an increase in inactivity amongst 16-34 year olds (+8.0%) and a decrease in inactivity amongst over 75's (-15.8%). |
 |
EthnicityDue to limited sample sizes we have limited ethnicity data across the Greater Manchester boroughs. In Manchester the lowest inactivity rates by ethnicity are found amongst those from a White Other background, 24.4% and White British, 25.6% and the highest levels of inactivity are amongst the Black community, 43.5%, and South Asians, 36.4%. |
If you have questions about this data please email: [email protected]
All data is rounded to one decimal point, you can access the raw data here.
Published June 2021