Oldham Adult Activity Levels May 2020-21
The latest Active Lives results published by Sport England show that 62.4% of adults in Oldham are active for at least 30 minutes a week, equating to 115,100 adults moving; a decrease of 13,900 from the survey 12 months ago.

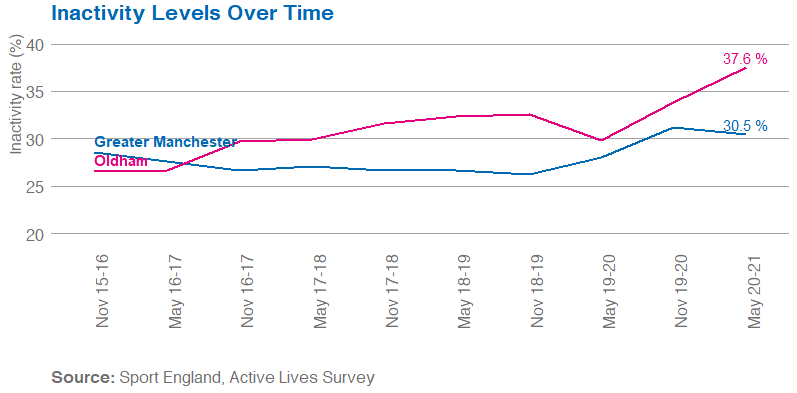
Oldham Overview
62.4% of adults in Oldham are now moving (active and fairly active), this equates to 115,100 adults. Since Active Lives launched, November 2015-16, inactivity in Oldham has increased by 11.0%, meanwhile in Greater Manchester the rate has increased by 2.0%, in the last 12 months it has risen by 7.7% in Oldham.
Demographic data
 |
The inactivity gender gap in Oldham is 0.6%Since November 15/16 the gender gap has decreased by 1.5%, however, the gap has inverted with men previously more inactive than women. This change is due to a larger increase in inactivity amongst women (+11.6%) compared to men (+8.9%). |
 |
The inactivity socio-economic gap in Oldham is 32.6%Since November 15/16 the socio-economic gap has increased by 11.0%. This change is due to a large increase in inactivity amongst lower social groups (+13.5%), NS-SEC 6-8, and an increase in inactivity amongst higher social groups (+2.5%) NS-SEC 1-2. Learn more about activity levels related to socio-economic status here |
 |
The inactivity disability gap in Oldham is 20.8%Since November 15/16 the disability gap has increased by 2.7%. Inactivity has risen amongst both those with a long term limiting disability and those without. However the rate of increase has been greater amongst those with a long term limiting disability (+13.3%) than in those without a long term limiting disability (+10.6%). Learn more about activity levels related to disability and long term health conditions here |
 |
The inactivity age gap in Oldham is 25.9%Since May 16/17 the age gap has increased by 0.4%. This is a result of similar increases in inactivity amongst over 75's (16.4%) and 16 to 34 year olds (16.1%). |
 |
EthnicityDue to limited sample sizes we have limited ethnicity data across the Greater Manchester boroughs. In Oldham 34.2% of those from a White British background are inactive compared to 49.2% of South Asians. |
If you have questions about this data please email: [email protected]
All data is rounded to one decimal point, you can access the raw data here.
Published October 2021