Wigan Adult Activity Levels Nov 2020-21
The latest Active Lives results published by Sport England show that 70.8% of adults in Wigan are active for at least 30 minutes a week, equating to 190,200 adults moving; an increase of 17,700 from the survey 12 months ago.

Wigan Overview
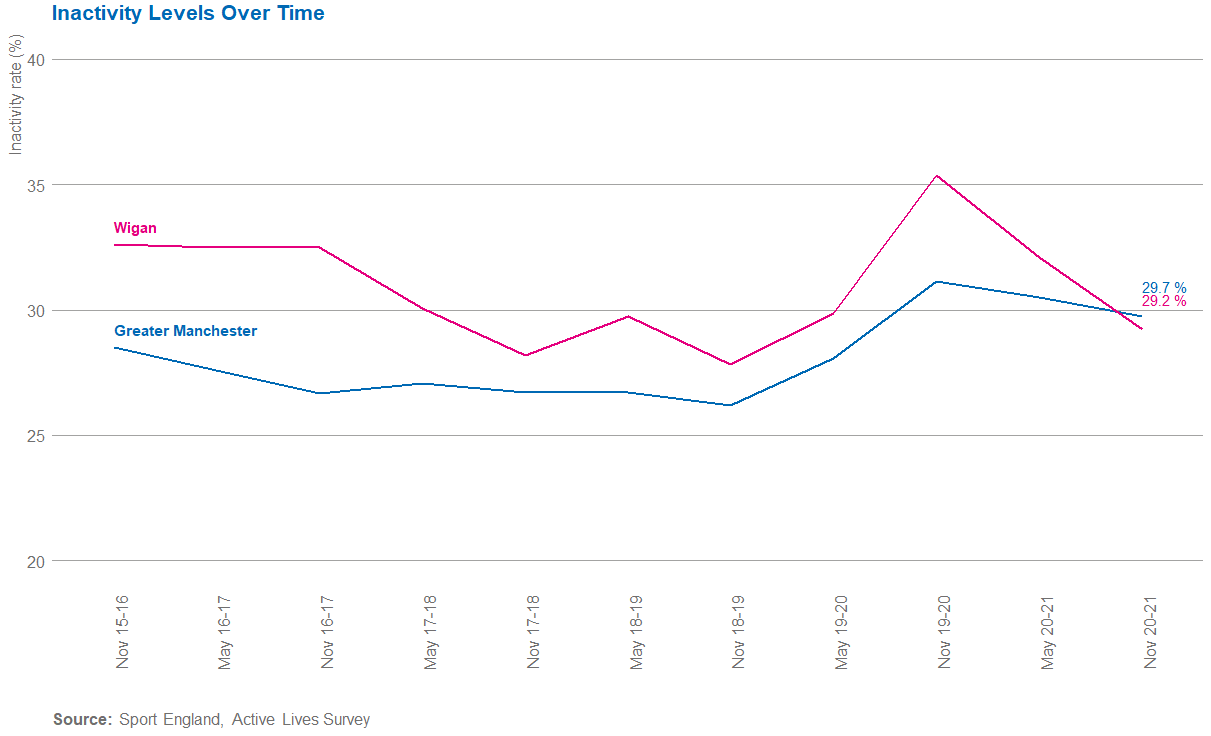
Wigan is showing faster signs of recovery than Greater Manchester (GM) following the pandemic, which is good because a greater recovery needed after a bigger pandemic impact (inactivity increased in GM by 4.5% compared to 7.5% in Wigan, from November 2018-19 to November 2019-20).
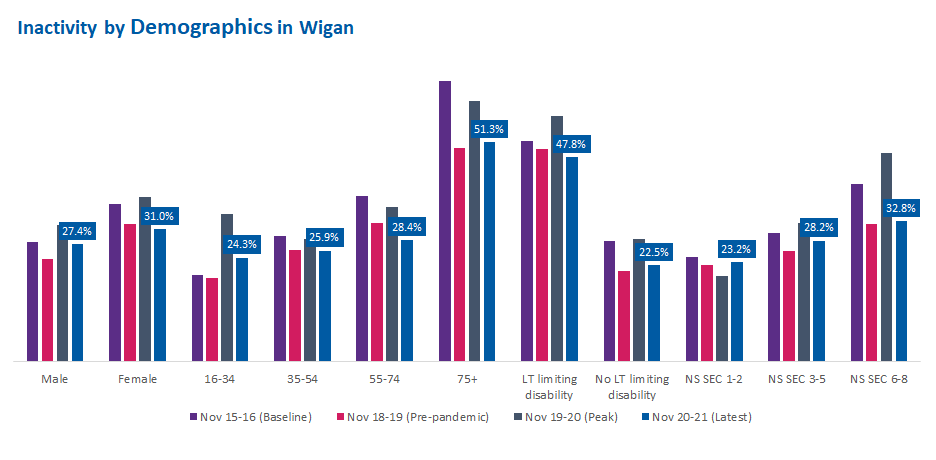
Although the trend across all demographics is consistent; inactivity decreased from baseline (November 2015-16) to its lowest pre-pandemic (November 2018-19), then peaked in November 2019-20 and is now showing signs of recovery.
There is a concerning underlying picture, with those with a Long term health condition (LTHC) or disability or those aged 75+ are still most likely to be inactive, doing less than 30minutes a week.
However, lower socio-economic groups (NS SEC 6-8) in Wigan are showing much lower rates of inactivity than GM (32.8% compared to 41.9% respectively) and recovery to pre-pandemic levels.
Walking for leisure and fitness increasing, whilst sport, walking for travel and cycling are decreasing.
Moving Rates
70.8% of adults in Wigan are now moving (active and fairly active), this equates to 190,200 adults. Since Active Lives launched, November 2015-16, inactivity in Wigan has decreased by 3.4%, meanwhile in GM the rate has increased by 1.2%, in the last 12 months, it has decreased by 6.1% in Wigan.
Demographic data
 |
The inactivity gender gap in Wigan is 3.5%Since November 15/16 the gender gap has decreased by 5.4%. This change is due to a decrease in inactivity amongst women (-6.0%) and a smaller decrease in inactivity amongst men (-0.5%). |
 |
The inactivity socio-economic gap in Wigan is 9.5%Since November 15/16 the socio-economic gap has decreased by 7.4%. This change is due to an increase in inactivity amongst lower social groups (+1.0%), NS-SEC 6-8, and a decrease in inactivity amongst higher social groups (-2.2%) NS-SEC 1-2. Learn more about activity levels related to socio-economic status here |
 |
The inactivity disability gap in Wigan is 25.2%Since November 15/16 the disability gap has increased by 1.8%. This is a result of inactivity falling amongst those without a long term limiting disability (-5.6%) and amongst those with a long term limiting disability but to a lesser extent (-3.8%). Learn more about activity levels related to disability and long term health conditions here |
 |
The inactivity age gap in Wigan is 27.1%Since November 15/16 the age gap has decreased by 18.4%. This is a result of inactivity amongst over 75's declining (-14.4%) whilst inactivity has risen for 16 to 34 year olds (+4.0%). |
 |
EthnicityDue to limited sample sizes we have limited ethnicity data across the Greater Manchester boroughs. In Wigan 28.8% of those from a White British background are inactive. |
If you have questions about this data please email: [email protected]
Published April 2022