Bury Adult Activity Levels May 2019/20
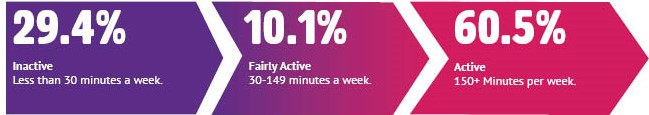
The latest Active Lives results published by Sport England shows that 70.6% of adults in Bury are active for at least 30 minutes a week, this equates to 107,400 adults moving. This is a decrease of 5,700 from 12 months ago.

Bury Overview
The latest Active Lives Release, May 2019/20, has seen an increase (4.2%) in the inactive population in Bury in the last 12 months. Bury has seen the percentage of people moving, active for at least 30 minutes a week, decrease by 3.1% since Active Lives began (November 2015/16) in comparison Greater Manchester as a whole has increased the moving population by 0.5% in the same time period.
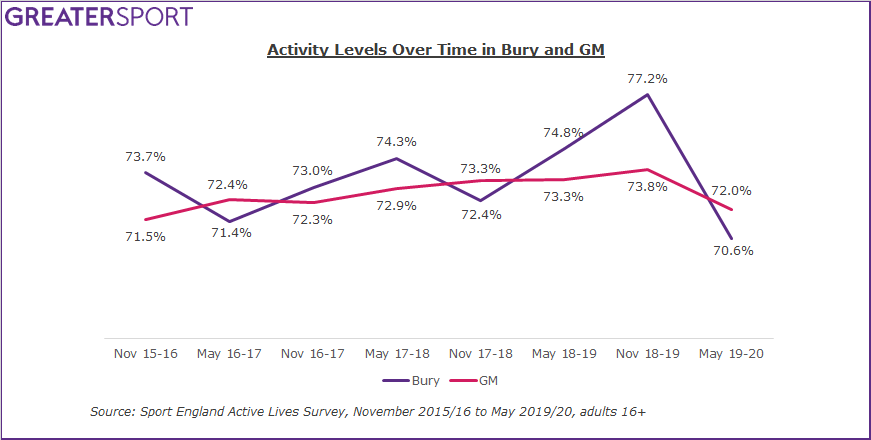
When this latest release is combined with activity data on children and young people, 123,800 Bury residents are moving.
Find out more about activity levels of children and young people in Bury here.
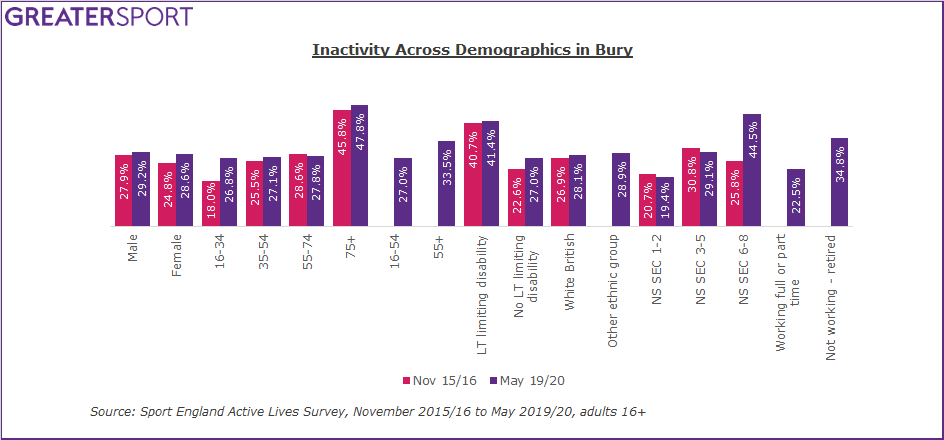
Inactivity Across Demographics
The largest inactivity gap amongst adults in Bury is the socio-economic gap with a 25.1% gap, the smallest is the gender gap with a 0.6% gap.
2.5% Gender gap decrease since Nov 15/16
The inactivity gender gap in Bury is 0.6%, however the gender gap in Bury sees higher levels of inactivity amongst men. The change has been driven by a slower rate of increase in male inactivity (+1.3%) than in female inactivity (+3.8%).
6.7% Age gap decrease since Nov 15/16
The inactivity age gap in Bury is 21.1%. This decrease has been driven by an increase in inactivity amongst 16-34 year olds (+8.8%) over four times that of the increase in over 75's (+2.1%).
19.9% Socio-economic gap increase since Nov 15/16
The inactivity socio-economic gap in Bury is 25.1%. The increase in gap size is a result of decreasing inactivity amongst higher socio-economic groups (-1.3%), NS-SEC 1-2, and an increase in inactivity amongst lower socio-economic groups (+18.6%), NS-SEC 6-8.
3.8% Disability gap decrease since Nov 15/16
The inactivity disability gap in Bury is 14.4%. The change has been driven by a greater increase in inactivity amongst those with no long term limiting disability (+4.5%) than amongst those with a long term limiting disability (+0.7%).
Overall, the highest levels of inactivity are amongst the over 75's (47.8%), those from lower socio-economic groups, NS-SEC 6-8, (44.5%) and those with long term limiting disabilities (41.4%). The lowest levels of inactivity are amongst higher socio-economic groups, NS-SEC 1-2 (19.4%), those working full or part time (22.5%) and 16 to 34 year olds (26.8%).