Greater Manchester Activity Levels Nov 19-20: Socio-Economic
A detailed breakdown of the latest Active Lives research from Sport England exploring the differences in activity levels by socio-economic status across Greater Manchester.

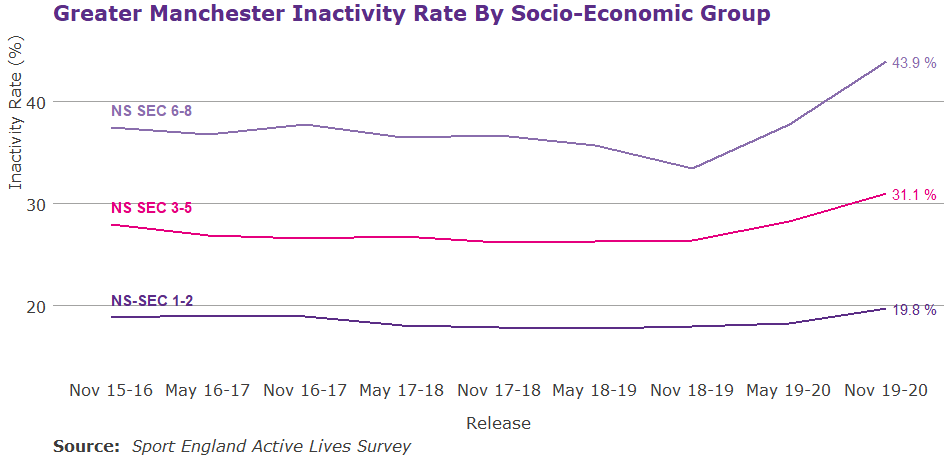
In Greater Manchester the inactivity socio-economic gap is 24.2%, this gap has widened since November 2015/16 (baseline) by 5.5%. This widening of the gap has increased at more than double the national rate, in the same time frame England has seen the gap widened by 2.4%. Whilst inactivity has increased amongst both higher social groups (NS-SEC 1-2) and lower social groups (NS-SEC 6-8), the latter has seen the greater increase (+6.5% v. +1.0%).
When looking at the changes over time it's clear that the widening of the gap has primarily been driven by an increase in inactivity in the last 12 months, with the rate of increase being related to social group. Lower social groups have seen the greatest increase (+10.4%), followed by middle social groups (+4.6%) and lower social groups (+1.8%). Prior to the last 12 months, both lower and middle social groups had seen minimal change; in the first four years of the survey both these groups saw less than a 1.5% change in inactivity. However, amongst lower social groups more positive change had been seen; whilst there was a small degree of fluctuation with each release, in the first four years of the survey inactivity had fallen amongst this group by 3.9%.
Borough Picture
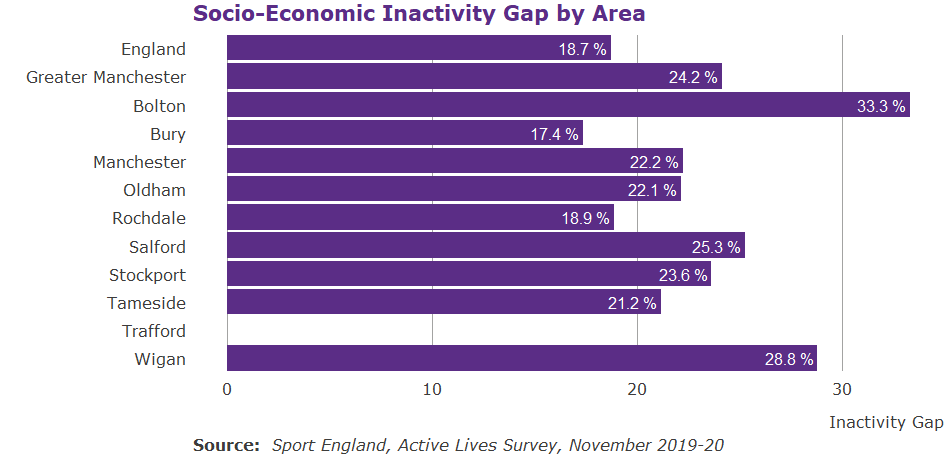
Of the nine boroughs of Greater Manchester that a socio-economic gap can be calculated for (Trafford's sample size for lower social groups was too small), only one, Bury, has a smaller gap than the England average. However, this disguises the large increase in the socio-economic gap in Bury, at baseline the gap was just 5.2%. Overall, just one borough, Manchester, has seen a narrowing of the gap since baseline and this is just a minor decrease (-0.2%).
Socio-economic status and other factors
We know that numerous factors intersect and compound the differences we see in activity levels amongst different cohorts. As such it is important to not look at demographics in isolation.
Gender
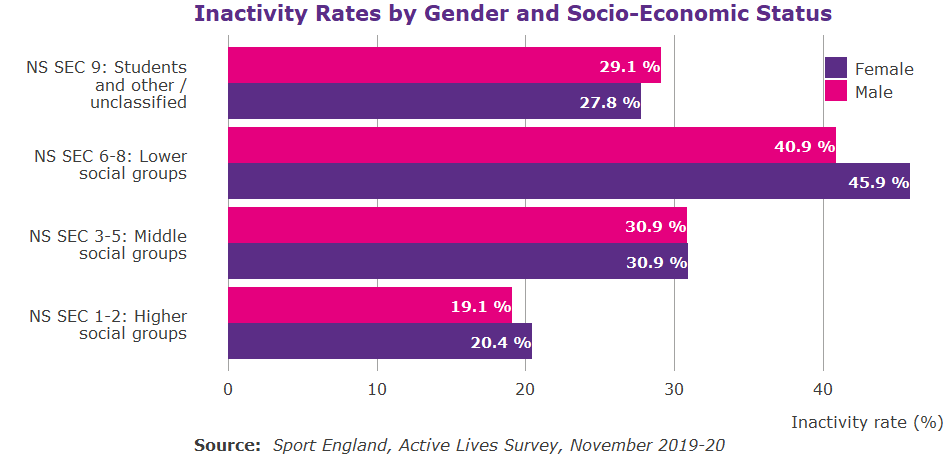
Overall in Greater Manchester the gender gap is 2.3% with women more inactive than men, however, this varies by social grade. The greatest difference is seen between those from lower social groups where there is a 5.0% gap in inactivity between men and women, amongst middle social groups there is no difference in inactivity by gender. However, amongst NS-SEC 9, students and others, the gap is inverted with men having a higher rate of inactivity.
Disability
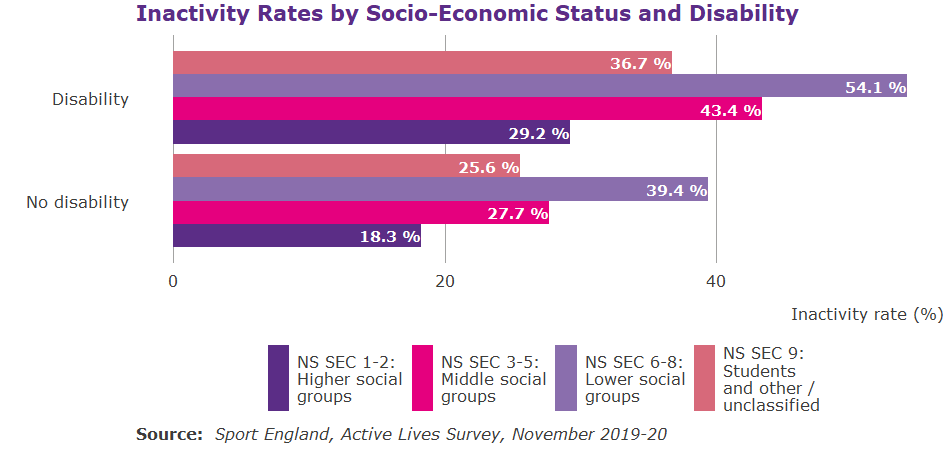
The disability inactivity gap as a whole in Greater Manchester is 19.4% and there is minimal variation by social grade. The pattern of inactivity by social grade is relatively consistent by disability status with inactivity being higher for those with a disability. Amongst those with a disability the socio-economic gap is 24.9% and for those with no disability it is 21.1%. However, there is typically a large increase in inactivity amongst those aged over 75 and their exclusion from social grade calculations are likely to have influenced the disability, socio-economic status interaction.
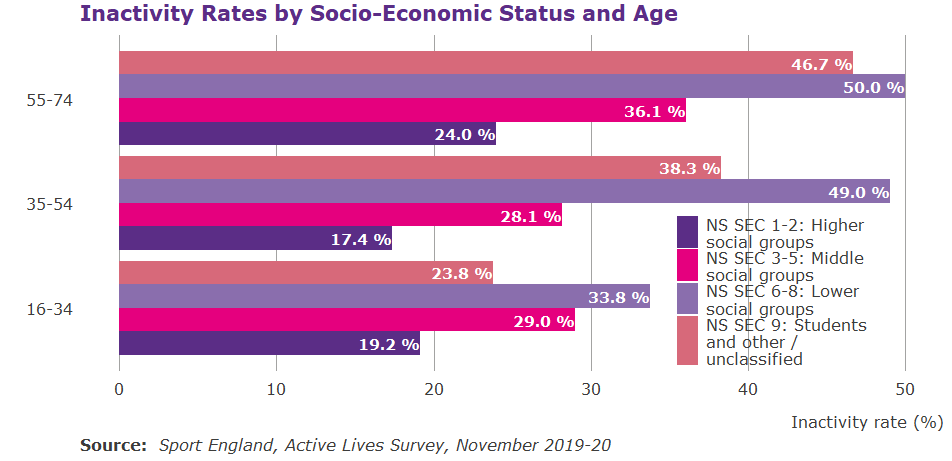
Age
Whilst at a Greater Manchester level we typically calculate the inactivity age gap as the difference in inactivity between over 75's and 16 to 34 year olds. However for the purposes of exploring the interactions between age and social grade we calculate the difference in inactivity between 55 to 74 year olds and 16 to 34 year olds; in Greater Manchester this gap is 9.5%.
Amongst students and others the gap is 22.9% and amongst lower social groups the difference is 16.2%, whilst amongst higher social groups the gap is 6.6%. Whilst typically we see an increase in inactivity with age it is important to note that this pattern isn't seen initially amongst higher and middle social groups which both see inactivity fall for 35 to 54 year olds.
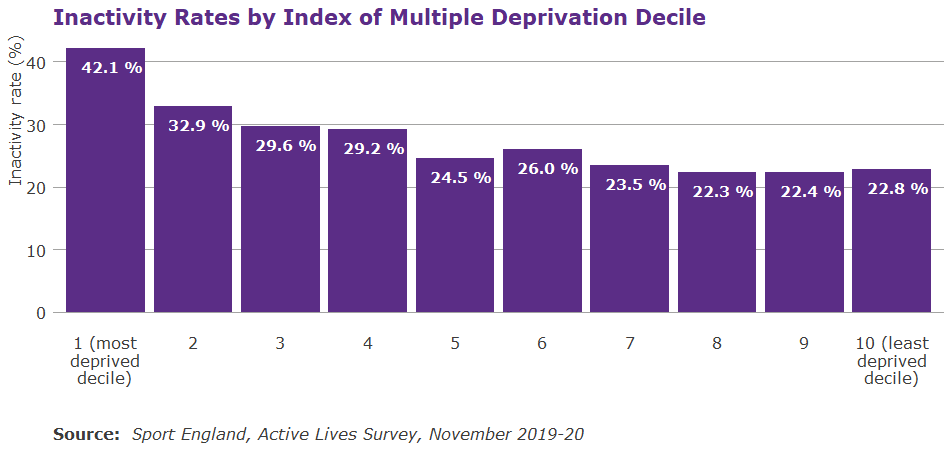
Deprivation: A breakdown
The most deprived areas in Greater Manchester see the highest inactivity rates, 42.1%, and the relationship between deprivation and inactivity is most clearly apparent in the more deprived areas with inactivity falling steadily as deprivation decreases, in the most deprived half of areas. Inactivity levels then plateau in the least deprived areas with the lowest levels of inactivity being found in the 8th decile.
Sport England, through their Tackling Inactivity and Economic Disadvantage programme, offers further information on how to engage those from low socio-economic backgrounds in physical activity.
More information on the latest Active Lives release can be found here. Find out more about the relationship between socio-economic status and physical activity here.
If you have questions about this data please email: [email protected]
N.B. All samples involving socio-economic status are limited to 16-74 year olds.
All data is rounded to one decimal point.
Published June 2021