Greater Manchester Activity Levels Nov 18-19: Disability and Long Term Health Conditions
A detailed breakdown of the latest Active Lives research into the activity levels of people with disabilities and health conditions in Greater Manchester.

A number of inactivity inequality gaps exist and whilst they may have narrowed, to varying degrees, across Greater Manchester (GM) we can still see clear gender, age, disability, socio-economic status and ethnicity gaps. Many of these factors overlap and further compound the differences.
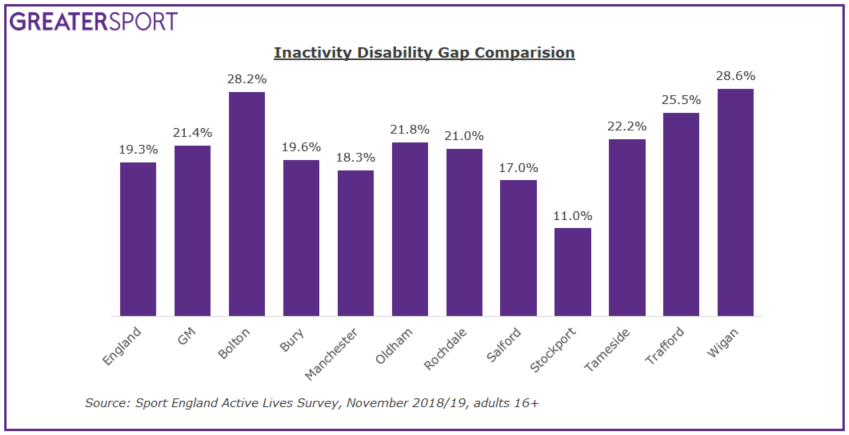
In the latest Active Lives release the inactivity disability gap in GM is 21.4% which is larger than the England gap of 19.3%, the gap is also closing at a slower rate than across England as a whole. In GM the inactivity disability gap has shrunk by 1.3% since baseline (November 2015/16) whereas nationally it has shrunk by more than twice this (3.0%). Across GM there are noticeable differences between the ten boroughs with the gap varying from 11.0% in Stockport to 28.6% in Wigan and overall five of the boroughs have a wider inactivity gap than England.
Disabilities and Long Term Health Conditions: A breakdown
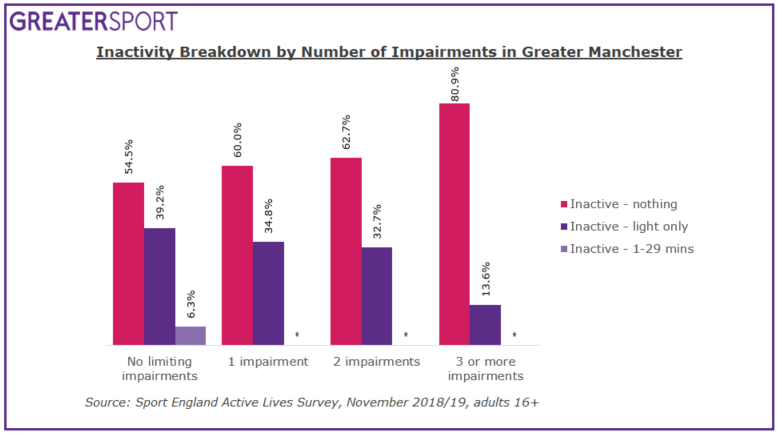
Inactivity levels for those with a physically limiting disability is over double that of the inactivity levels of those with no disability, 43.2% compared to 21.8%, a gap of 21.4%. This difference is more pronounced when looking at the number of impairments a person has. Inactivity increases by over 15% when comparing those with one impairment to those with no limiting impairments. The figure continues to rise with additional impairments; those with three or more impairments have an inactivity rate 10% higher than those with only one and over double that of those with no impairments.
Furthermore when inactivity is broken down, it is clear that amongst all groups the majority of people who are classified as inactive are doing no physical activity (rather than anything up to 30 minutes). This figure is particularly high amongst those with three or more impairments where eight in ten of those classified as inactive, do nothing (see graph below).
Four in ten of those with a disability who are inactive do participate in physical activity, however not at a high enough intensity for it to count towards Chief Medical Officer guidance for physical activity. This varies from 34.8% of those with one impairment to 13.6% amongst those with three or more impairments.
Disability Type
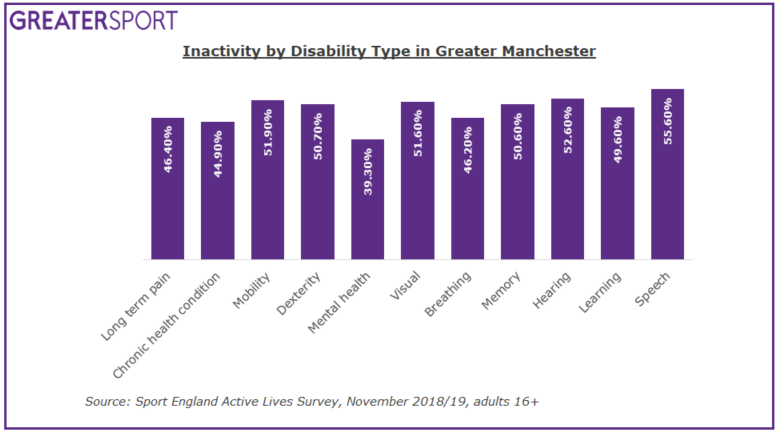
When broken down by disability type, the highest levels of inactivity across Greater Manchester are amongst those with a speech disability (55.6%) followed by hearing and mobility (52.6% and 51.9% respectively). The lowest inactivity rates were amongst those with other disabilities (37.2%) and those with mental health conditions (39.3%).
Disability and other factors
It is important to note that disability amplifies the gender gap, the gender inactivity gap overall in GM is 2.5% with women more likely to be inactive. Amongst those with disabilities the inactivity gender gap is 4.1%, 40.8% of men with a disability are inactive compared to 44.9% of women with a disability. When the disability–gender relationship is broken down by number of impairments the highest levels of inactivity are amongst men with three or more impairments (48.6%), followed by women with three or more impairments (48.3%). The starkest difference is amongst those with two impairments with females having an inactivity rate almost 50% higher than males (46.4% v. 31.7%).
Activity Alliance offer further information on the experiences of people with disabilities and long term health conditions and how to engage them in physical activity.
More information on the latest Active Lives release can be found here. Find out more about the relationship between disability, long term health conditions and physical activity here.