Greater Manchester Activity Levels Nov 19-20: Age
A detailed breakdown of the latest Active Lives research from Sport England exploring the differences in activity levels by age across Greater Manchester.

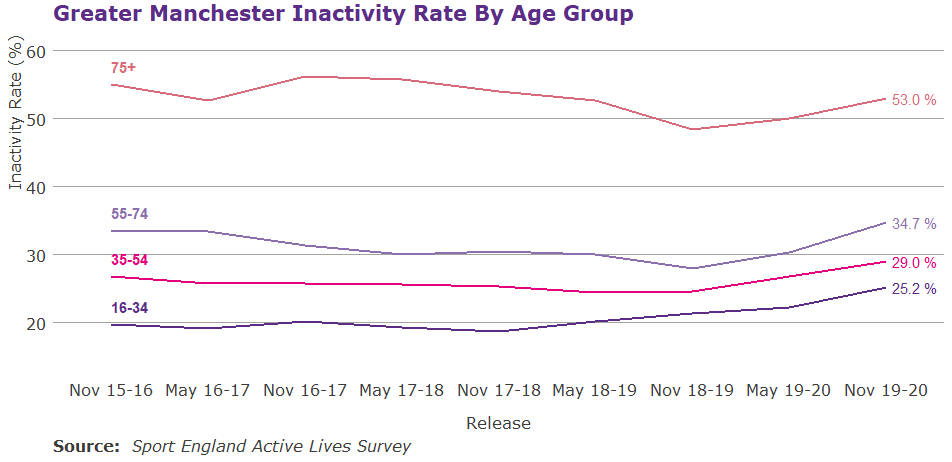
The inactivity age gap in Greater Manchester is 27.8% and since November 15/16 (baseline) the age gap has decreased by 7.4%. This has been driven by an increase in inactivity amongst 16 to 34 year olds (+5.4%) and a decrease in inactivity amongst over 75's (-2.0%).
Borough Comparison
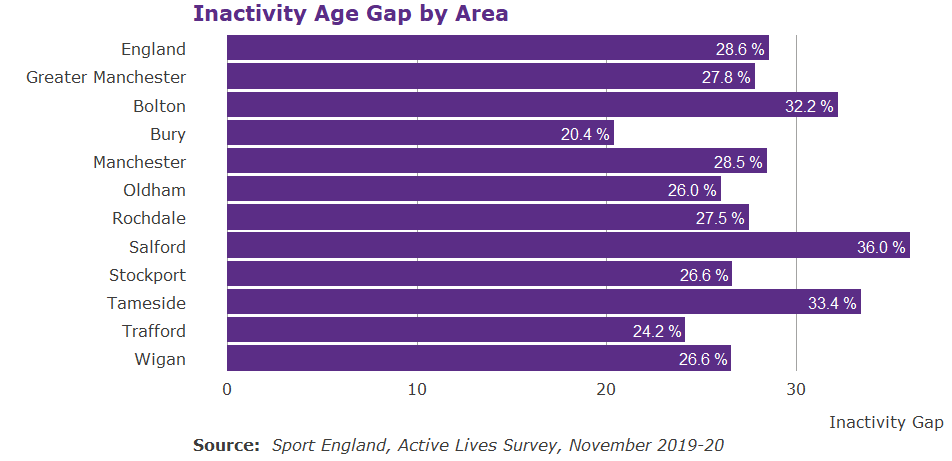
Whilst Greater Manchester as a whole has a smaller inactivity age gap (the difference in inactivity amongst over 75s and 16 to 34 year olds) than England there is considerable variation across the ten boroughs. Overall three boroughs, Bolton, Salford and Tameside have larger inactivity gaps than England whilst Bury has the smallest gap at 20.4%, this is 4.2% smaller than Trafford which has the next smallest gap. Whilst these gaps are still large there has been a considerable reduction in the gap since November 2015/16 in some areas. Manchester has narrowed the gap by 23.8% and Wigan by 18.8%, however, Tameside and Oldham have seen the gap grow, +1.6% and +0.4% respectively.
Age and Other Factors
We know that numerous factors intersect and compound the differences we see in activity levels amongst different cohorts. As such it is important to not look at demographics in isolation.
Socio-economic status
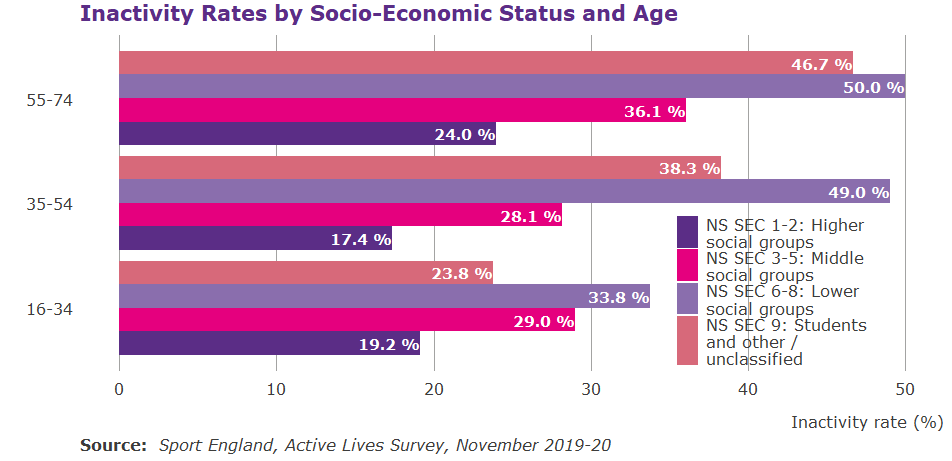
In Greater Manchester the socio-economic inactivity gap is 24.2%, however this varies by age. Amongst 16 to 34 year olds the inactivity gap is 14.6%, amongst 35 to 54 year olds it is 31.6% and amongst 55 to 74 year olds in is 24%.
Age
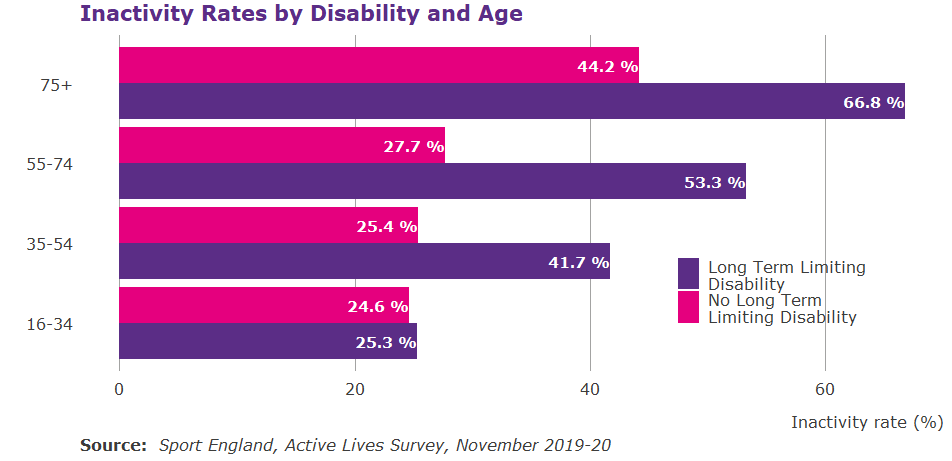
Whilst the inactivity disability gap in Greater Manchester is 19.4% it varies considerably by age. Whilst inactivity is relatively similar amongst young adults, 16 to 34 year olds, inactivity levels start to diverge significantly in middle age. The disability gap peaks amongst 55 to 74 year olds at 25.6%, however, there is still a large gap amongst over 75's, 22.6%.
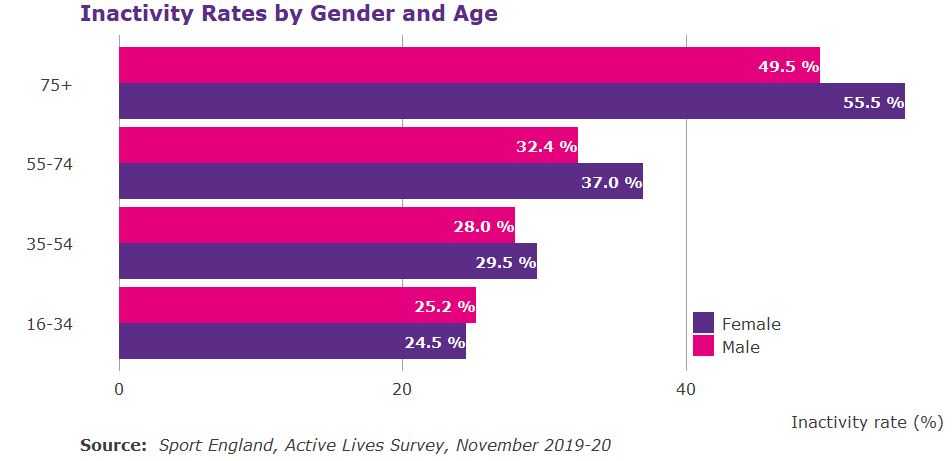
Gender
Overall in Greater Manchester the inactivity gender gap is 2.3%, however, this gap varies by age. Amongst 16 to 34 years olds the gap is 0.7%, with men being more inactive, but this gap increases with age and women become more inactive, amongst over 75's the gap is 6.0%. The growth of the gender gap with age is down to women's inactivity increasing at a faster rate than men's as they age.
More information on the latest Active Lives release can be found here. Find out more about the relationship between age and physical activity here.
If you have questions about this data please email: [email protected]
All data is rounded to one decimal point.
Published June 2021