Greater Manchester Activity Levels Nov 18-19: Age
A detailed breakdown of the latest Active Lives research into the difference in activity levels across ages in Greater Manchester.

A number of inactivity inequality gaps exist and whilst they may have narrowed, to varying degrees, across Greater Manchester (GM) we can still see clear gender, age, disability, socio-economic status and ethnicity gaps. Many of these factors overlap and further compound the differences.
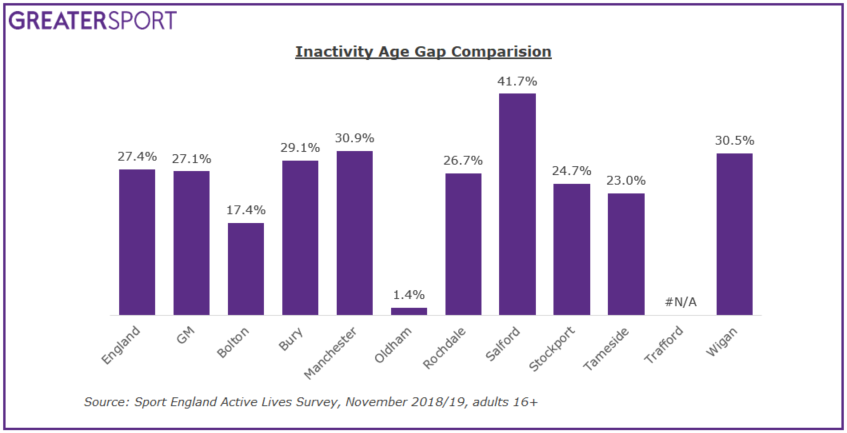
In the latest Active Lives release the inactivity age gap, when comparing 16-34 year olds to those aged over 75, in GM is 27.1% which is smaller than the England gap of 27.4%; the gap is also closing at a faster rate than across England as a whole. In GM the inactivity gender gap has shrunk by 8.2% since baseline (November 2015/16) whereas nationally it has shrunk by 8.9%. Across GM there are noticeable differences between the ten boroughs with the gap varying from 1.4% in Oldham to 41.7% in Salford and overall four of the boroughs have a wider inactivity gap than England.
Age: A breakdown
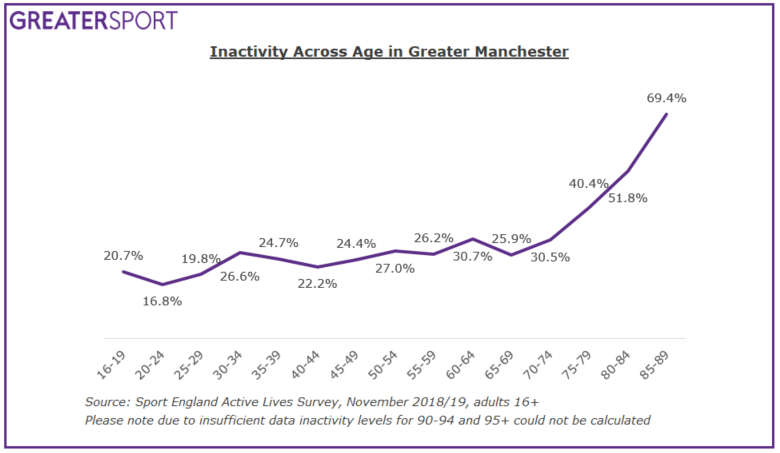
Inactivity levels for those aged 75+ is over double that of 16-34 year olds, 48.4% compared to 21.4%. However when looking in more detail, there is more variance and a less linear relationship between age and inactivity. When age is broken into five year bands the lowest inactivity rate is amongst 20-24 year olds (16.8%) and the highest is amongst 85-89 year olds (69.4%). The three lowest rates of inactivity are amongst 16-19, 20-24 and 25-34 year olds, however there is a noticeable increase in inactivity amongst those aged 30-34 and 35-39 which then decreases amongst 40-44 year olds.
Whilst inactivity levels rise with age it is important to note that older adults are more likely to take part in low intensity activities, such as walking, which is more accessible to all ages. When looking at walking, the age group most likely to have walked at least twice in past 28 days is those aged 55-64 with over two thirds (67.0%) walking regularly. This is nearly 10% higher than the next highest age group, 35-54 year olds, with 58.1% walking at least twice in the past 28 days.
When this is broken down further, interesting patterns emerge; 16-19 year olds have the second lowest walking rate with less than half (49.9%) walking twice in the last 28 days. The highest walking rates come from 65-69 and 70-74 year olds (77.1% and 74.0%) however, from the age of 80 these figures start to fall, with 54.3% of 80-84 year olds and just 36.9% of 85-89 year olds walking regularly.
More information on the latest Active Lives release can be found here.
More information on engaging older adults in physical activity can be found from Sport England here. Find out more about the relationship between age and physical activity here.